
When Replacing POTS Pays Back
2 min read
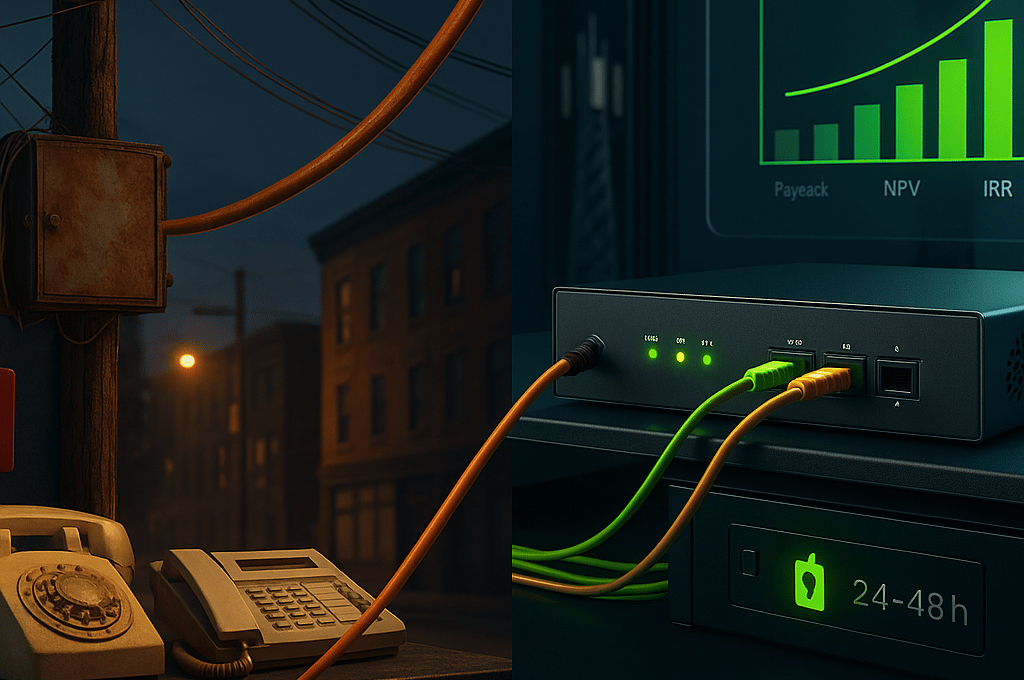
ROI Math: When Replacing POTS Actually Pays Back
If you’re still paying for POTS lines, you’re likely sitting on a fast payback. The math comes down to (1) your true POTS cost today (base + fees + annual hikes) vs. (2) the all-in cost of a modern replacement (capex + monthly), (3) the time value of money, and (4) risk avoided (outages, CO compliance, surprise retirements). This guide shows you the exact formulas—and gives you a calculator to run your own numbers.
Step 1 — Know your real “as-is” cost
For each site:
* Current monthly = Number of POTS lines × (base per line + taxes/fees per line)
* Yearly annual = Current monthly × 12
Many businesses are seeing 6–12% annual increases on legacy lines. Even “small” hikes compound into big dollars over a 3–5 year term.
Step 2 — Price the replacement correctly
Break it into CAPEX and MRC:
Up-front (CAPEX per site)
* Replacement device (POTS-in-a-Box / analog gateway)
* Install labor / wiring
* Battery backup (24–48h)
* Minus any credits/incentives
Monthly Recurring Cost (MRC per site)
* Monitoring/portal
* LTE/5G data plan (for failover & alarms)
* SIP/VoIP trunk / calling plan
* Any other recurring (e.g., static IP)
Totals
* CAPEX (all sites) = Sites × (device + install + battery) + credits
* New MRC (all sites) = Sites × (portal + LTE + SIP + other)
Step 3 — Simple payback (quick read)
* Year-1 monthly savings = (Current annual − New annual) ÷ 12
* Payback (months) = CAPEX ÷ Year-1 monthly savings
If payback < 18 months** and the solution meets compliance/resiliency, it’s usually a green light.
Step 4 — NPV and IRR (finance-grade)
Treat savings as cash flows:
* t=0: −CAPEX
* t=1..Term: Annual savings (with both sides’ escalators)
NPV = Σ (Savings_t / (1 + discount)^t) − CAPEX
IRR = the discount rate where NPV = 0
Use your WACC or hurdle rate (often 8–12%) as the discount rate. Projects with NPV > 0 and IRR > hurdle create value.
Step 5 — Breakeven MRC (guardrail)
What’s the maximum you can pay monthly and still break even in Year 1?
Breakeven MRC/site = (Current monthly for all sites ÷ Sites) ÷ 12
If your new MRC/site is below this, you’re saving money immediately (even before escalators).
Example (plug numbers into the calculator)
Sites: *5*
Lines/site: *4*
Current per line: *$85 base + $15 fees*
POTS escalator: *8%*
Device: *$900*, Install: $350, Battery: $200 per site
Monitoring: *$8*, LTE: $20, SIP: $25 per site/month
New service escalator: *2%*
Term: *5 years*, Discount rate: 10%
Outputs (typical):
Payback: ~*12–16 months*
NPV (5 yrs): *positive* unless your new MRC is unusually high
IRR: typically *> 30%* in high-POTS-cost markets
(Your mileage varies—run your exact inputs below.)
Common pitfalls (and how to avoid them)
* Forgetting taxes/fees: add them per line; they’re real dollars.
* Ignoring escalators: both old and new services change over time.
* No power plan: budget the battery; it matters for life-safety lines.
* Thin resiliency: include LTE/5G failover—savings don’t help if inspections fail.
* Missing monitoring: operational visibility prevents “silent failures.”
Need help running the numbers on your bill?
Send your latest invoice and site count—we’ll return a one-page ROI + cutover plan. No fee.